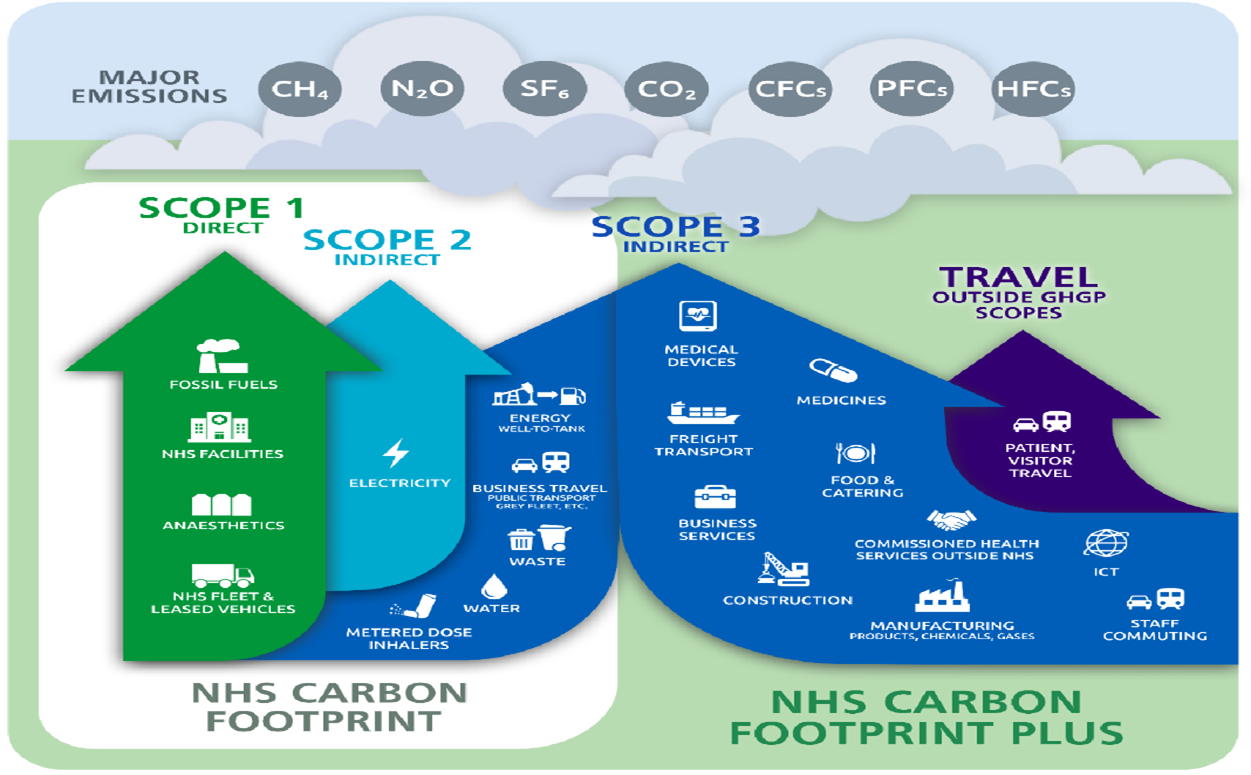
In order to support the Trust in its ambition to become net zero carbon by 2040, in line with legislation, a carbon foot printing exercise was carried out in conjunction with a specialist consultancy. Trust carbon emissions for scopes 1,2 and 3 (Fig 1) were calculated based on data available for the period 2019/2020.
This data will be used as a baseline from which progress made in reducing our carbon emissions and the impact on the environment will be measured. The following carbon emission baseline data for LPFT from 2019/2020 is as follows:
Carbon Hot spots 2019/2020
| Building energy | Business travel and NHS fleet | Waste and water | |
|---|---|---|---|
| Tonnes of CO2 produced | 1997 | 3332 | 20 |
Total annual tonnes of CO2 produced: 5349
Annual carbon reduction performance
When compared to our baseline year, the Trust has reduced its overall carbon footprint by 2,148 tonnes, a reduction of 40%.
- Table 1 demonstrates the Trust total annual carbon footprint (tonnes) from the baseline year 2019/20 to 2022/23, the percentage reduction in carbon from the baseline year is also indicated.
- Table 2 demonstrates the split of carbon emissions between energy, waste and water, and business travel.
Table 1
|
Year |
CO2te | % reduction against baseline |
|---|---|---|
| 2019-20 | 5,349 | |
| 2020-21 | 3,330 | 38% |
| 2021-22 | 3,041 | 43% |
| 2022-23 | 3,201 | 40% |
Table 2
| Year | Energy and waste/water CO2te | % of total CO2te | Business travel CO2te | % of total CO2te |
|---|---|---|---|---|
| 2019-20 | 2,017 | 38% | 3,332 | 62% |
| 2020-21 | 1,849 | 55% | 1,481 | 65% |
| 2021-22 | 1,297 | 43% | 1,744 | 57% |
| 2022-23 | 1,022 | 32% | 2,179 | 68% |
Energy performance
In comparison to the baseline year, the annual consumption of gas was reduced by 1,576,000 kWh’s, with a reduction in CO2te of 289 tonnes. Whilst weather conditions are a factor in the consumption of gas, a considerable amount of work and financial investment in energy efficiency projects has been the major factor. The use of electricity was reduced by 248,000 kWh’s, with a reduction in CO2te of 698 tonnes, again energy efficiency projects have been completed, but the main factor for the large reduction in CO2te, is due to a change in the supply of electricity, from a high carbon tariff to a zero-carbon source of electricity.
The Trust electricity supply is generated by zero carbon nuclear power generation. This source of electricity generation was chosen in preference to renewable energy generation, due to the financial impact and pressure the purchase of renewable energy would have put on the Trust finances. Based on the electricity consumption for 2022/23, the purchase of renewable energy would have cost the Trust an additional £776,000.
Statement from NHS England (NHSE): NHSE formally recognises that not all trusts can afford to pay for the REGO certificates (Renewable Energy), and it’s a suggestion rather than a requirement in the draft Standard Contract currently out for consultation. We’ll be reporting it, but there will be no sanction for trusts that don’t meet the requirement.
Table 3
Compares the annual consumption of gas and electricity, and the respective carbon emissions, from the baseline year to 2022/23. Annual carbon emissions from waste and water are also shown.
Annual energy and CO2te data
| Gas kWh | Gas CO2te | % Reduction against baseline | Electricity kWh | Electricity CO2te | % Reduction against baseline | Waste and water CO2te | |
|---|---|---|---|---|---|---|---|
| 2019/2020 | 6,890,000 | 1,262 | 2,290,000 | 735 | 20 | ||
| 2020/2021 | 6,221,000 | 1,143 | 9% | 2,023,000 | 696 | 5% | 10 |
| 2021/2022 | 6,795,000 | 1,245 | 1% | 2,155,000 | 40 | 94% | 12 |
| 2022/2023 | 5,314,000 | 973 | 23% | 2,042,000 | 37 | 95% | 12 |
Travel and transport
For the period 2022/23 there has been an increase in business mileage on the previous year of 1,353,000 miles, with an increase of CO2te by 435 tonnes. However, 2022/23 business mileage is still 2,917,000 miles, and 1,153 tonnes of carbon, less than the baseline year. This increase in mileage and CO2te can be attributed to the return to normal levels of activity post COVID, which is evident across the whole country, and in our everyday lives.
Table 4
Shows the annual mileage and CO2te comparison from the 2019/20 baseline year to 2022/23, with the percentage reduction against the baseline year also shown.
| Business mileage | CO2te | % reduction against baseline |
|
|---|---|---|---|
| 2019/2020 | 9,007,000 | 3,332 | |
| 2020/2021 | 3,973,000 | 1,481 | 55% |
| 2021/2022 | 4,737,000 | 1,744 | 48% |
| 2022/2023 | 6,090,000 | 2,179 | 35% |
Table 5
Shows the breakdown of the Trust business mileage for 2022/23, it should be noted that the pool vehicle mileage is only estimated, based on previous limited data available.
| Staff petrol/ diesel mileage claimed |
Staff electric mileage claimed |
Pool vehicles | Estates vans | Staff public transport claimed | |
|---|---|---|---|---|---|
| Business mileage | 5,452,471 | 119,918 | 459,288 | 37,986 | 20,338 |
| CO2te | 1,951 | 9 | 164 | 52 | 3 |
Table 6
Show the data collected for the Trust network of electric vehicle (EV) chargers that are located at Ash Villa (Sleaford), Elm Lodge (Grantham), Holly Lodge (Skegness), Witham Court (North Hykeham) and Trust HQ (Lincoln). The data shows the ongoing increase in the use of the chargers, each session counts as one charge per vehicle.
Trust EV Charger Net Work Data 2022/23
| Q1 | Q2 | Q3 | Q4 | Totals | |
|---|---|---|---|---|---|
| Sessions | 337 | 364 | 480 | 674 | 1,855 |
| Consumption (kWh) | 4,462.49 | 4,646.96 | 6,944.13 | 12,267.95 | 28,321.53 |
| Cost @£0.29 per kWh | £1,294.12 | £1,347.62 | £2,013.80 | £3,557.71 | £8,213.24 |
| Unique drivers | 28 | 15 | 45 | 48 | 136 |
| CO2te saving | 2.5 | 2.6 | 3.9 | 6.9 | 15.9 |
In addition, the Trust has introduced discounted sustainable bus travel provided by Stagecoach for staff in Lincoln and surrounding villages.
Overall carbon emissions for the Trust in 2022/23 did increase by 160 tonnes as a result of an increase in business mileage, this could be attributed to a return in some areas to pre-covid ways of working. However, great progress continues to be made in the reduction of carbon emissions from energy consumed, with a reduction in 2022/23 of 275 tonnes of carbon.
Projects
Following investment in energy efficiency measures at the Beaconfield Centre, Francis Willis Unit and Witham Court in 2021/22, table 7 shows the following savings on energy, cost and CO2te were made in 2022/23.
Table 7 - Energy data
| Site | 21/22 | CO2te | 22/23 | kWh saved | Cost saving | CO2te |
|---|---|---|---|---|---|---|
| Witham Court | 1,069,468 | 231 | 934,833 | 134,635 | £11k | 25 |
| Francis Willis Unit | 465,511 | 101 | 339,174 | 126,337 | £10k | 23 |
| Beaconfield | 194,787 | 42 | 95,490 | 99,297 | £8k | 18 |
| Total | 1,729,766 | 374 | 1,369,497 | 360,269 | £29k | 66 |
The Sycamore Centre on the Beaconfield site in Grantham has had all the heating and hot water systems, that previously ran on gas, removed, and replaced with air source heats pumps and point of use electric water heaters. As a result, we will save approximately 50 tonnes of carbon each year, with no increase in energy costs.
LED lighting has also been installed at the Beaconfield Centre in Grantham.
Digital transformation and medicines
The Trust’s electronic prescription and medicines administration system (ePMA) has now been introduced on all inpatient wards reducing the need for pharmacy and medical staff to be on site to prescribe, check or order medication for patients. This has been particularly useful where medics are off site and previously had to travel to write a prescription, and with pharmacy who can now check and order remotely reducing our travel need and CO2 footprint. The plan is to now roll this system out into community services during 2023/24, reducing the need for potential travel even further and giving staff a more flexible option around prescribing, checking and ordering medicines. This also significantly reduces the need for paper charts as it is all electronic based.
Food and nutrition
- New regeneration trollies have been introduced in all inpatient areas. These run more efficiently and ensure that food is cooked to the optimum temperature, making this more appetising and in turn reducing waste.
- Food waste is now recorded, and we are actively working to reduce volume.
- We have begun to move away from macerating food waste, which is likely to be banned in the future, similar to Scotland.
- Ward 12 food waste in Boston is currently going for anaerobic digestion and we are exploring the possibility of food waste from other sites being directed out of the household waste stream.
- We have reduced the amount of packaging used in the production of plated meals.
- We are exploring options for procuring patient meals more locally in the future and are already working with the local acute trust to provide our supply of patient sandwiches and salads.
- As a Trust we only award contracts via NHS Supply Chain and all new contracts are awarded and evaluated against social values and need to demonstrate how they will dispose of their waste, reduce the amount of single use plastic used, as well as reduce the travel required.
- We have reduced the number of deliveries of food per week by changing to frozen rather than chilled meals. This also allows any excess meals, as a result of ward numbers fluctuating, to be frozen for future use, rather than disposed of.
- Our menu options now include more plant based, vegetarian and vegan options.
- All sites have water cooler provision and staff have been issued with reusable water bottles to encourage hydration and reduce plastic packaging.
- Discounts are offered in Discovery café, the Trust’s patient run café provision for people using reusable cups for hot drinks.
- Wards now have standardised recipes for when cooking on the ward to ensure optimum nutrition and consistency.
- Finally, we have increased our communication of the sustainable initiatives all staff can adopt at work and home.
Waste and recycling
- In the past year we have had over 3,900 waste collections from our sites, amassing 194 tonnes of non-clinical waste. 37% of this has been recycled, which is an increase from 31% the previous year.
- Recycling percentages across the Trust continue to vary, with the highest performing site at Welton House in Lincoln recycling three quarters of all waste.
- 100% of waste is diverted from landfill, meaning that it is either recycled directly, or goes to an Energy Recovery Facility (ERF) where it will be incinerated to recover electricity.
- In line with the new NHS Clinical Waste Strategy launched in March 2023 we have met our first target for all NHS providers to introduce arrangements for the management of the offensive waste by 2023. We are now working towards increasing the percentage of clinical waste classified as offensive, with the aim of reducing hazardous waste volumes through improved segregation.
- All waste contracts are awarded with sustainability in mind and our washroom hygiene contractors align with not sending any waste to landfill and through ERFs as an alternative.